Blog · September 24, 2026 · Guides
Common county GIS map layers explained (and how to read them)
Open any busy county GIS viewer and you will find a layer list: parcels, aerials, zoning, flood, contours, and more. Knowing what each layer means — and what it does not mean — keeps you from treating a colorful map like a survey. This guide explains the layers people search for most and how to read them responsibly.
Platbookmapper is an Amazon Associate. If you buy through an Amazon link on this page, we earn a commission. The link is a product, not the county map.
Parcels (tax lot polygons)
The parcel layer is the star of public property GIS. Each polygon represents a tax assessment unit with an ID (APN, PIN, folio, account — naming varies). Popups often show owner-of-record labels, situs address, acreage, and links to assessor cards.
How to read it: identify the lot, copy the ID, compare neighbors. How not to read it: as a legal boundary guarantee. Tax maps can lag splits, generalize curves, and sit slightly off imagery.
Zoning and land-use overlays
Zoning layers color the map by district (residential, commercial, industrial, mixed use, and local variants). They help answer “what district is this parcel in?” at a glance.
How to read it: note the district code, then verify with the planning department’s ordinance text and any overlays (historic, airport, hillside). How not to read it: as a permit. Map color is not approval to build.
Flood and drainage hints
Many viewers offer floodplain or drainage-related overlays. They are useful for early risk screening after you know which parcel you mean.
How to read it: if a parcel intersects a flood-looking overlay, dig deeper with official flood resources and local drainage criteria. How not to read it: as an insurance quote or final determination. See flood zones on county parcel viewers for workflow tips.
Aerial imagery (orthophotos)
Aerials orient you: roofs, driveways, tree lines, and recent construction. Vintage matters — a 2018 flight will not show a 2025 addition.
How to read it: confirm you clicked the right building; compare multiple years if the county offers them. How not to read it: fence = boundary. People paint and rebuild fences off the line all the time.
Contours and elevation
Contour lines or elevation models show slope and drainage direction. Builders and buyers use them for rough site feel.
How to read it: closer contours mean steeper ground; use them to ask better questions of a surveyor or engineer. How not to read it: as a grading plan. Design work needs professional topographic survey.
Other layers you may meet
- Roads and addresses: navigation and situs checks.
- Political boundaries: city limits, commissioner districts, school districts.
- Utilities: sometimes approximate; never dig on a GIS guess — call the locating service required in your state.
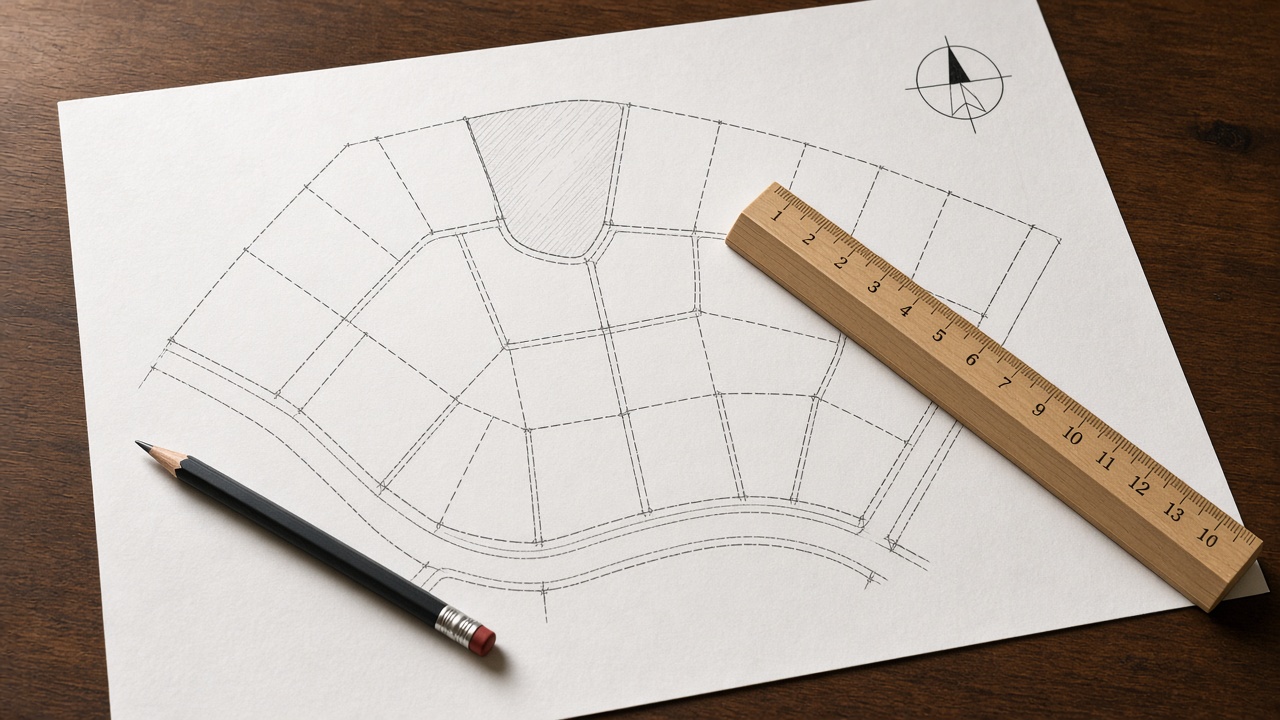
- Plats / subdivision outlines: helpful context, still not a field survey.
A practical layer-reading order
- Turn on parcels; find the ID.
- Toggle aerials to confirm the site.
- Check zoning only if land use matters.
- Screen flood overlays as a lead, not a verdict.
- Use contours for slope curiosity before hiring pros.
Open any county from the Platbookmapper directory to practice on the official viewer that actually hosts those layers for your land.
Layer mistakes that waste time
Turning on every layer at once creates visual noise. Toggle one theme at a time. Another common mistake is reading a zoning color as permission, or a flood tint as a final insurance answer. Layers are clues. Agency text and professional work are decisions.
Also watch basemap choice: a dark canvas with bright parcels can hide thin lines; an aerial basemap can make fences look like official boundaries. Switch basemaps when something looks “too perfect.”
Printing and sharing layers responsibly
If you export a PDF for a meeting, include the county name, parcel ID, date, and which layers were on. Without that metadata, tomorrow’s reader may think an old flood overlay is current. Prefer official export tools over phone photos of your monitor when you can.
Quick checklist before you leave the map
- County name matches the tax bill.
- Parcel / APN / PIN / folio / account ID copied exactly.
- Situs address on the popup matches the land you mean (not only the mailing address).
- Screenshot or official export saved with today’s date.
- Decision point noted: orientation only, or escalate to recorder / surveyor.
That five-line checklist prevents most “I looked at the wrong lot” mistakes. If any item is uncertain, stay in the official county viewer via Platbookmapper until it is resolved — do not switch to a consumer map and hope the blue line is wiser.
When you are done with identification, the next useful reads are usually about reading parcel maps, property lines and parcel boundaries, or when a survey is the real answer.
Open the Platbookmapper county GIS directory
Not a survey. County GIS and tax parcel maps are assessment and planning layers. They are not a substitute for a recorded plat, deed, or licensed survey — especially for fences, setbacks, or boundary disputes.